Nov 20, 2024 • 8:30 AM EST Intuit Launches AI-Powered Intuit Assist for QuickBooks, Giving Millions of Businesses a Competitive Edge
Nov 12, 2024 • 9:01 AM EST New Report from Intuit Mailchimp Shows Most Marketers are Using AI, Highlights Differentiators For Top Performers
Nov 7, 2024 • 5:00 AM EST Intuit Launches QuickBooks Sole Trader: Simplified Financial Management for the UK’s 3.1 million One-Person Businesses
Oct 29, 2024 • 8:30 AM EDT Intuit Showcases Product Innovations at Intuit Connect to Fuel Accountant Success and Drive Business Growth
Oct 15, 2024 • 8:30 AM EDT Intuit QuickBooks Report Reveals Small Businesses Project a Third of Yearly Revenue from Holiday Sales as Consumer Spending Expected to Decrease by 34%
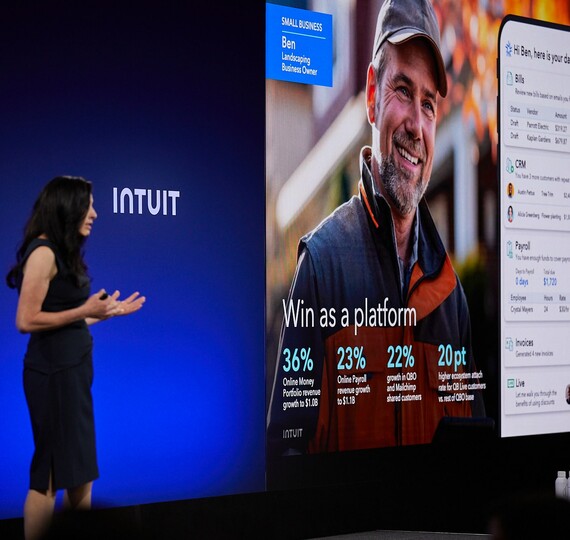
Sep 26, 2024 • 9:05 AM EDT Intuit Unveils New AI-driven Expert Platform Experiences at Investor Day 2024
Sep 26, 2024 • 9:00 AM EDT Intuit Hosts Investor Day, Reaffirms First-Quarter and Fiscal 2025 Guidance
Sep 25, 2024 • 9:00 AM EDT Intuit Pioneers Done-for-You Future for Consumers and Businesses with Agentic AI
Sep 17, 2024 • 8:30 AM EDT Intuit Introduces Intuit Enterprise Suite to Help Businesses Grow, Streamline Operations, and Scale